When an energy saving project is implemented and calculated, energy savings are realised, and everyone is happy. But how do we know that the new installation represents the best available? Frank Griffith explains.
Fan coils continue to be specified in large numbers by consulting engineers. Some years ago it seemed that chilled beams were poised to grab significant market share, but the fact that fan coils offer greater flexibility and are a tried and tested solution means they remain the option of choice for many design engineers - particularly where high outputs are required.
Saving energy is a matter of increasing interest to every building services consultant, contractor and facilities manager, with the building regulations setting tough energy requirements for any new installations and the CRC Energy Efficiency Scheme requiring businesses to pay for carbon allowances.
As the easy ways to save energy are becoming exhausted, looking for new and smarter ways to cut the heating ventilation and air conditioning system running costs is becoming increasingly important.
In particular, it is no longer sufficient to just look at the energy efficiency of installed components. The deciding factor is the energy usage of the component in combination with the load. This is where it gets complicated, because each installation is unique, with a specific setup of components, piping, ductwork and a required duty pattern.
The trick is to find the best duty point for the system. This is where the output of the pump or the fan matches the requirements of the system. Traditionally, the performance of a pump or fan system is plotted as a graph, or 'system curve', showing how resistance increases with higher flow. The resistance (known as 'head') is caused by friction in the system ('dynamic head'), as well as by the weight of the fluid if it is lifted to a higher level ('static head').
The system curve is compared with a pump or fan curve, which shows how much pressure (or 'head') the pump or fan can provide at a certain flow. If adequate system performance can be achieved with reduced flow, a lower pump or fan speed can be selected, the duty point moves down the system curve and energy savings are made (see graph 1).
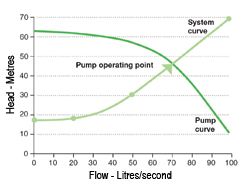
Graph 1
Snapshot of duty point
However, while this exercise will provide a snapshot of one alternative duty point, there is no guarantee that this is the best option available. Ideally, what we would like to have is a calculation of all the available duty points along the system curve so we can choose the best one, but to make all these calculations would be a very long-winded and tedious process.
The pump and system curves can be combined into a specific energy curve, simplifying the calculation process and allowing power consumption to be readily determined.
Specific energy is the energy per unit, for instance, joule required for every litre of water pumped. Using this curve, it is possible to find the point where the specific energy is lowest. By varying the output of the system to minimise specific energy, the most effective energy performance can easily be found.
The easiest and most flexible way to vary the output of the hvac system is to use a variable speed drive (VSD) to control the pump or fan motor, enabling different speed settings and system configurations. With the duty point selected correctly, the VSD can accurately maintain the most efficient operation around the duty point.
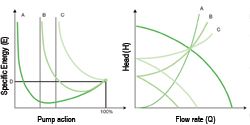
Graph 2
The most effective energy saving applications can be achieved in installations with low static head, where the majority of the resistance is due to friction. This is illustrated by graph 2.
Curve A represents a typical friction only system. For as long as the pump speed is below nominal speed (line D), there is a potential cost saving. As the proportion of static head increases, there is less potential for cost saving (curve B). At some value, the static head is such that the variable speed offers no potential for cost saving at all (curve C).
Rate equipment with margin
But for curves A and B, the least cost occurs below 100 per cent leading to the conclusion that the best duty point is at less than 100 per cent of nominal rating of the pump. This shows that it sometimes pays to rate equipment with some margin and not exactly as calculated.
The graph on the right -n graph 2 shows the same conditions plotted as traditional pump and system curves.
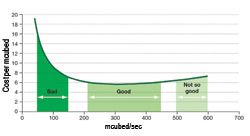
Graph 3
A specific energy curve can be used to evaluate different parameters for a system (see graph 3). For instance, it can be used to decide what flow range is suitable and how well the pump is matched to the system curve, see the figure below. In the bad flow range in this graph, i.e. where the pump is not appropriate for the duty, the energy cost per volume rises with reduced flow.
In the good flow range, the cost per volume does not vary significantly over the flow range.
The conclusion here is that to move a certain volume costs approximately the same, regardless of whether that volume is moved quickly (with high flow over shorter time) or slowly (with lower flow over longer time).
The specific energy curve can also help pinpoint energy savings with multiple pump operation. It may be more efficient to run two pumps at reduced duty than to run one at full speed.
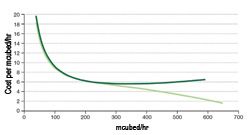
Graph 4
Graph 4 shows an example of how the energy requirement is reduced with dual pump operation.
There are many opportunities to improve efficiency, particularly in pump applications. Using VSDs, it is possible to move away from catalogue values and to get a system that truly optimises energy performance. This can often be achieved with existing equipment. With the specific energy curve, it is possible to pinpoint where the optimum performance lies.
• Frank Griffith is drives consultant engineer at ABB
8 August 2011
Entries are now open for this year’s HVR Awards, giving companies and individuals across the heating, ventilation and air conditioning sectors the chance to showcase their achievements and gain industry recognition....
17-Mar-2026
National Ventilation, a UK-based ventilation manufacturer and supplier, has launched its popular Monsoon Energysaver™ IntelliSense i7 fan in a sleek, black design....
22-Apr-2026
CONDENSING ULTRA LOW NOx PREMIX COMMERCIAL BOILER
10-Jan-2019